It’s not only about the number of validators
At Amamu we are strong advocates of consensus based on the Proof of Stake. We believe that it is a very effective mechanism to encourage the decentralization of networks, one of the essential legs on which blockchain technology must be based.
In this regard, voices are often heard defending the importance of networks having a good number of validation nodes and that the staking has to be distributed as evenly as possible among all of them. There are several ways to calculate this. Probably one of the most widely used is the Nakamoto Coefficient, with which we can calculate the danger of a network collapsing due to an excessive accumulation of staking in the hands of a few. In short, the Nakamoto coefficient is the number of entities you need to compromise at least one essential subsystem. If you want to know more about the Nakamoto Coefficient you can read this great article by Balaji and Leland Lee.
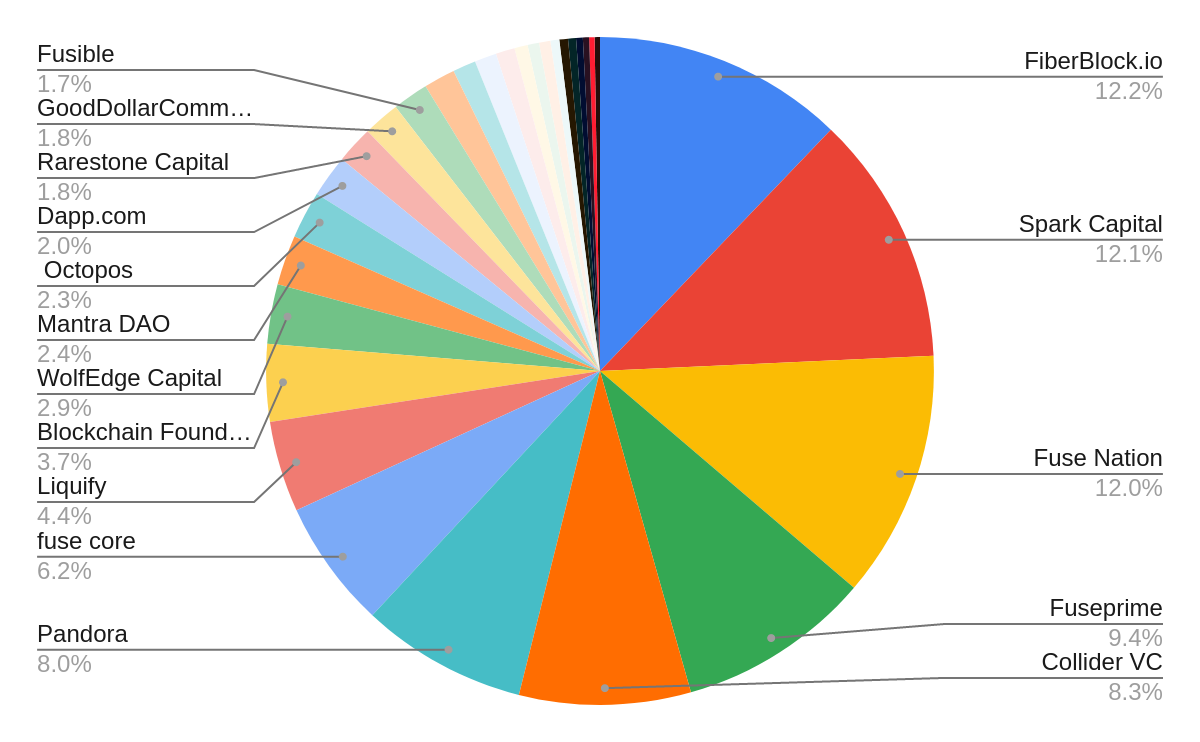
Of course, as a Fuse Network validator, we are also concerned about this, so we took very seriously the graphics that kindly sent us Chainflow (an organization we share concerns with), when we asked them to include that network in the Nakamoto Coefficient list they publish every Sunday:
 Graphic by Othman
Their data indicates that the Nakamoto Coefficient in Fuse Network is currently 5. It is not a very high coefficient, but there is no need to be alarmed. It is quite normal that at first the networks do not stand out precisely because of a high degree of decentralization in terms of the number of validation nodes.
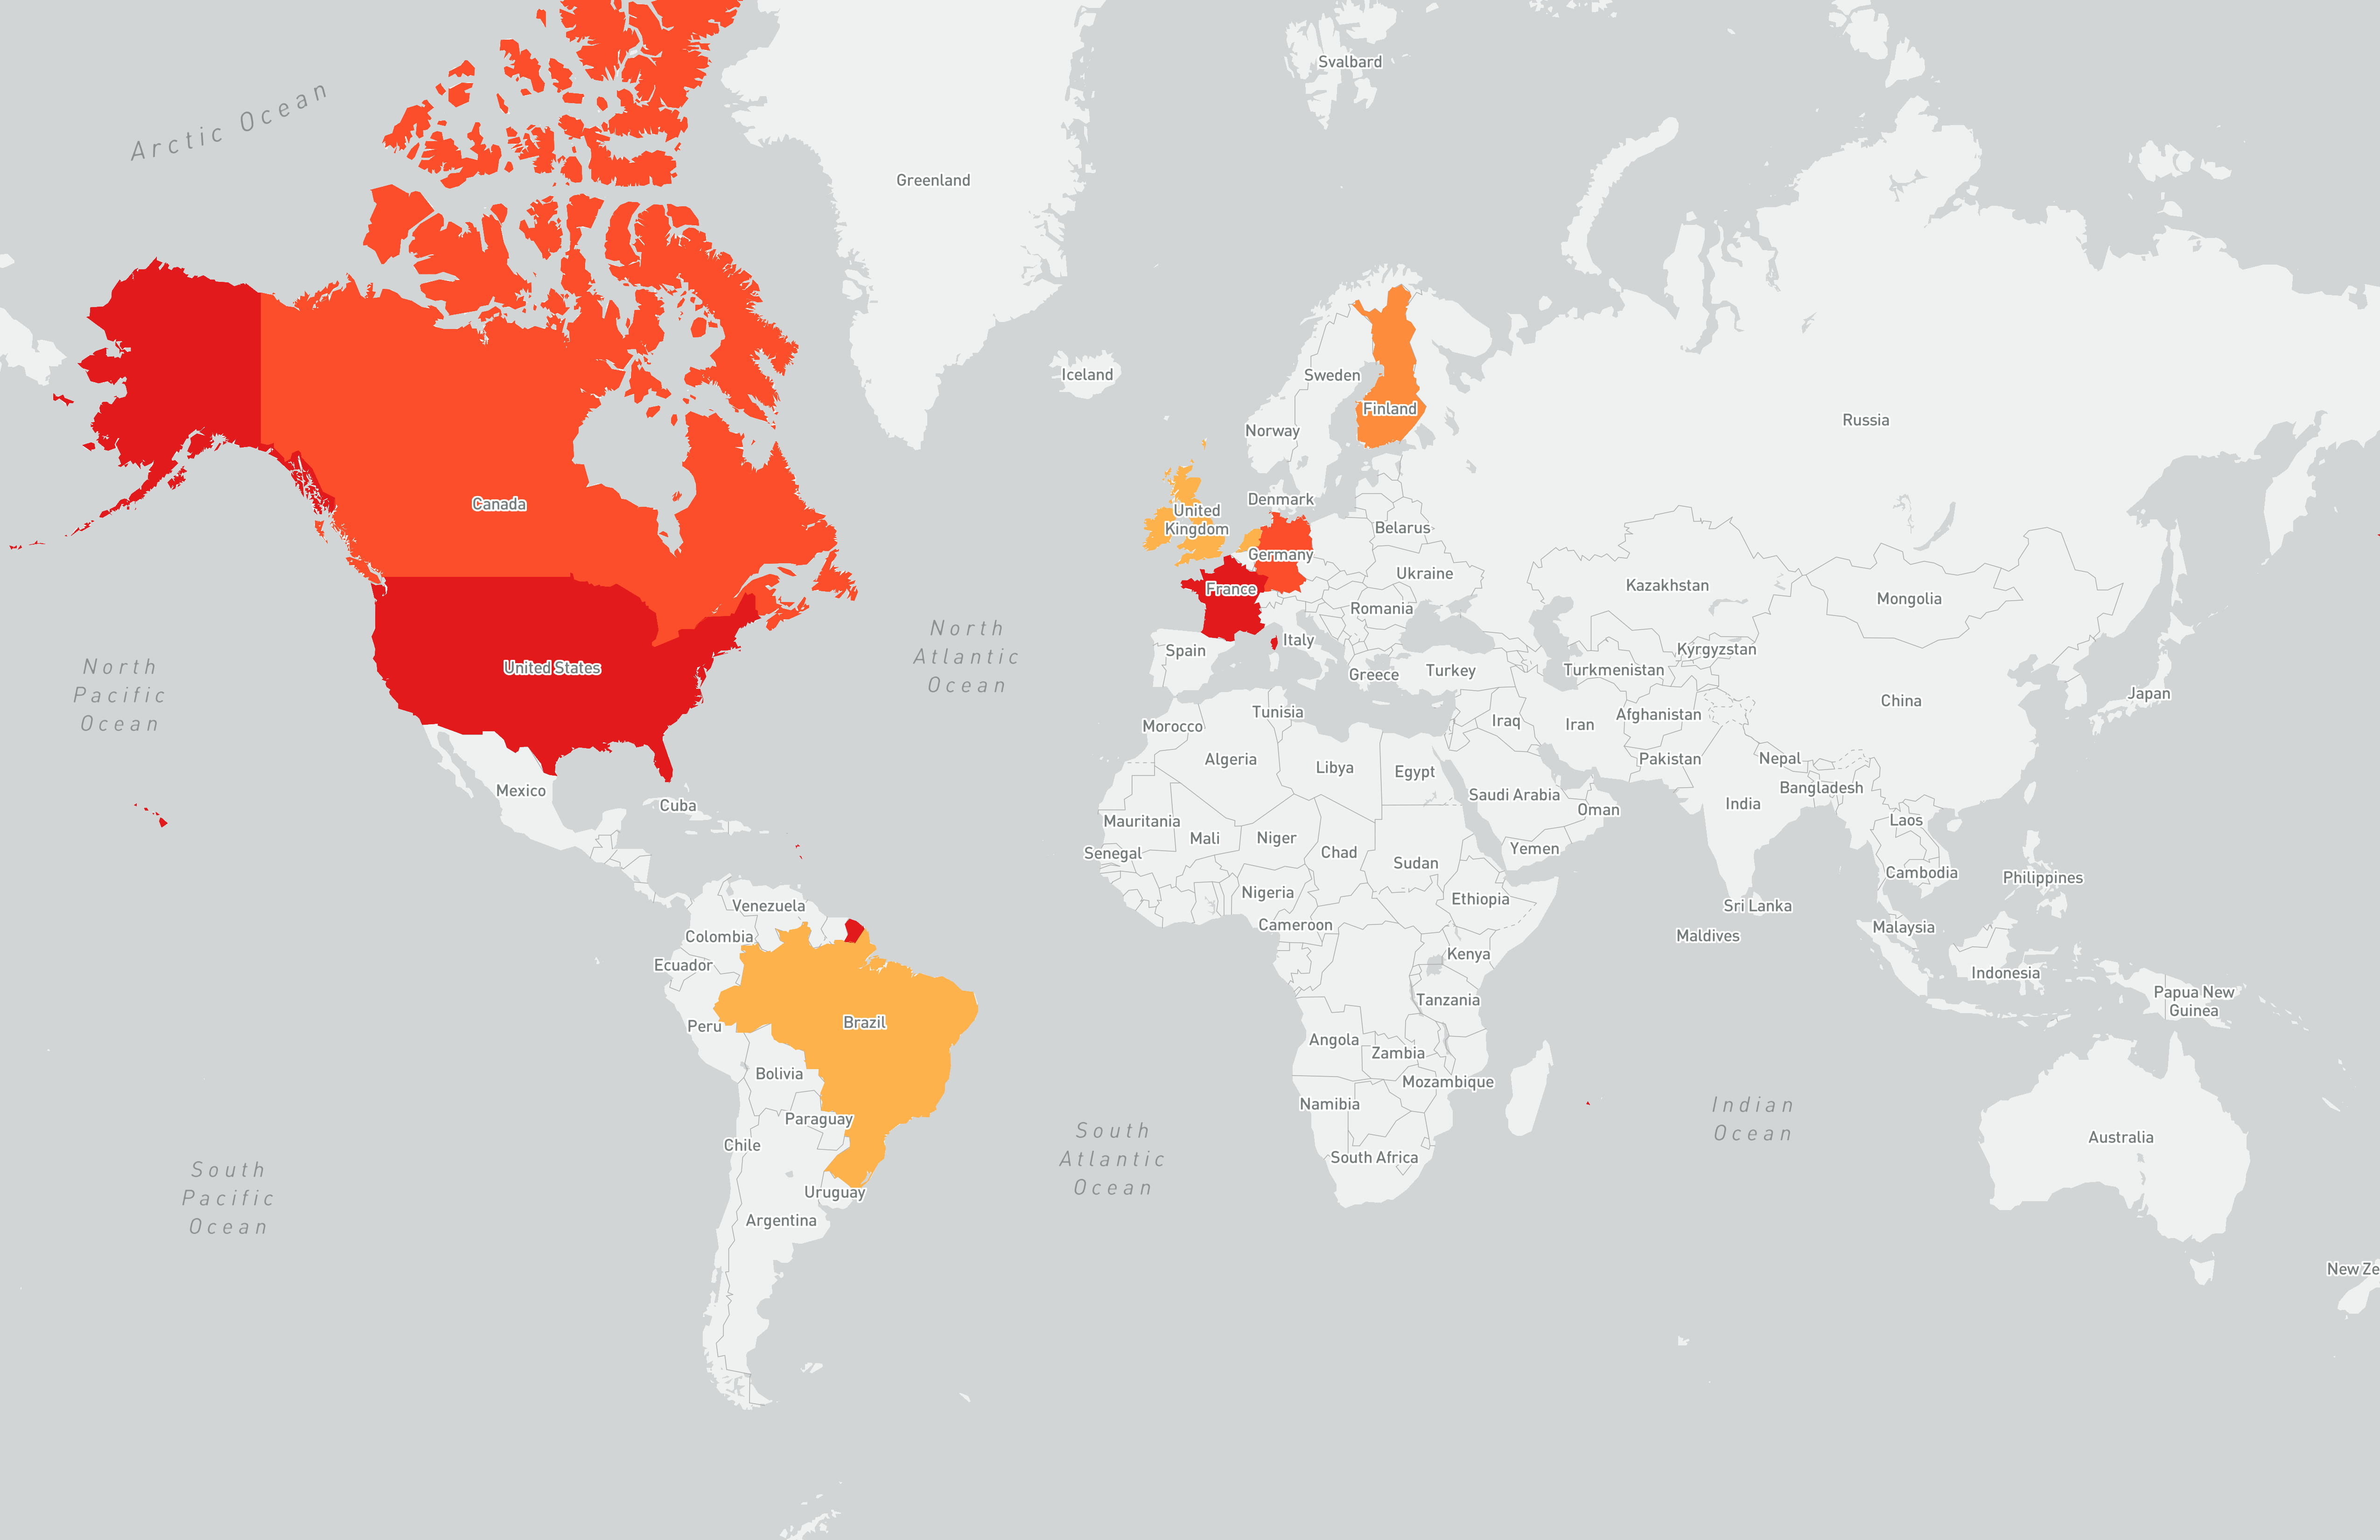
We blindly believe in the potential of the Fuse Network and are convinced that it will get more decentralized over time. But, of course, it is not only the number of validation nodes that is important in quantifying the decentralization of a network. So is, for example, the geographical diversity of these nodes and that of the Data Centers used. Therefore, at Amamu we spent some time analyzing the Fuse Network data on these issues and came to some interesting conclusions. Right now, validation nodes are located in these countries:
 Graphic by minimus
There are twelve in the US, twelve in France, nine in Germany, seven in Canada, four in Finland, two in the United Kingdom, one in Brazil, one in Ireland, one in the Netherlands, and one in Singapore.
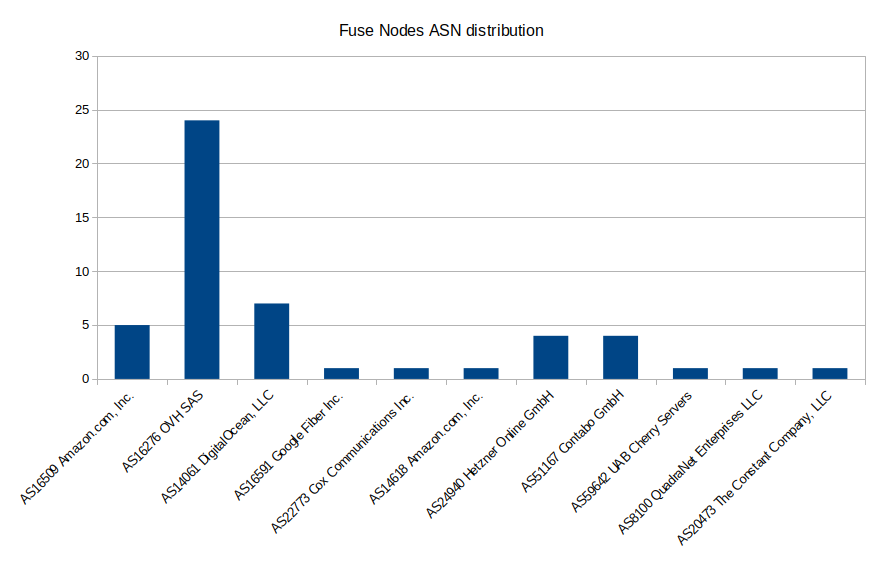
We have also seen that the diversity of Data Centers is distributed as follows:
| Datacenter | Number | Percentage |
|---|---|---|
| AS16509 Amazon.com, Inc. | 5 | 10.00% |
| AS16276 OVH SAS | 24 | 48.00% |
| AS14061 DigitalOcean, LLC | 7 | 14.00% |
| AS16591 Google Fiber Inc. | 1 | 2.00% |
| AS22773 Cox Communications Inc. | 1 | 2.00% |
| AS14618 Amazon.com, Inc. | 1 | 2.00% |
| AS24940 Hetzner Online GmbH | 4 | 8.00% |
| AS51167 Contabo GmbH | 4 | 8.00% |
| AS59642 UAB Cherry Servers | 1 | 2.00% |
| AS8100 QuadraNet Enterprises LLC | 1 | 2.00% |
| AS20473 The Constant Company, LLC | 1 | 2.00% |
 Graphic by minimus
As you can see, almost half of the nodes use the same server and 89.7% are in the hands of only 5 Data Centers. Obviously, these are data that have a wide margin for improvement, and we have no doubt that they will do so as time goes on. For now, in Amamu we have chosen to use the AS20473 The Constant Company, LLC Data Center, which is located in the United Kingdom. We are convinced that using a minority server (we are the only ones operating there) helps to diversify and therefore decentralize the network. In addition, we are committed to adapting to any variation in the data and will always do our best to collaborate in improving the performance and security of the network.
If anyone is curious, this is the code we used to extract the data.
